
This article provides a brief overview of random forest classification technique.
What is Random Forest Classification?
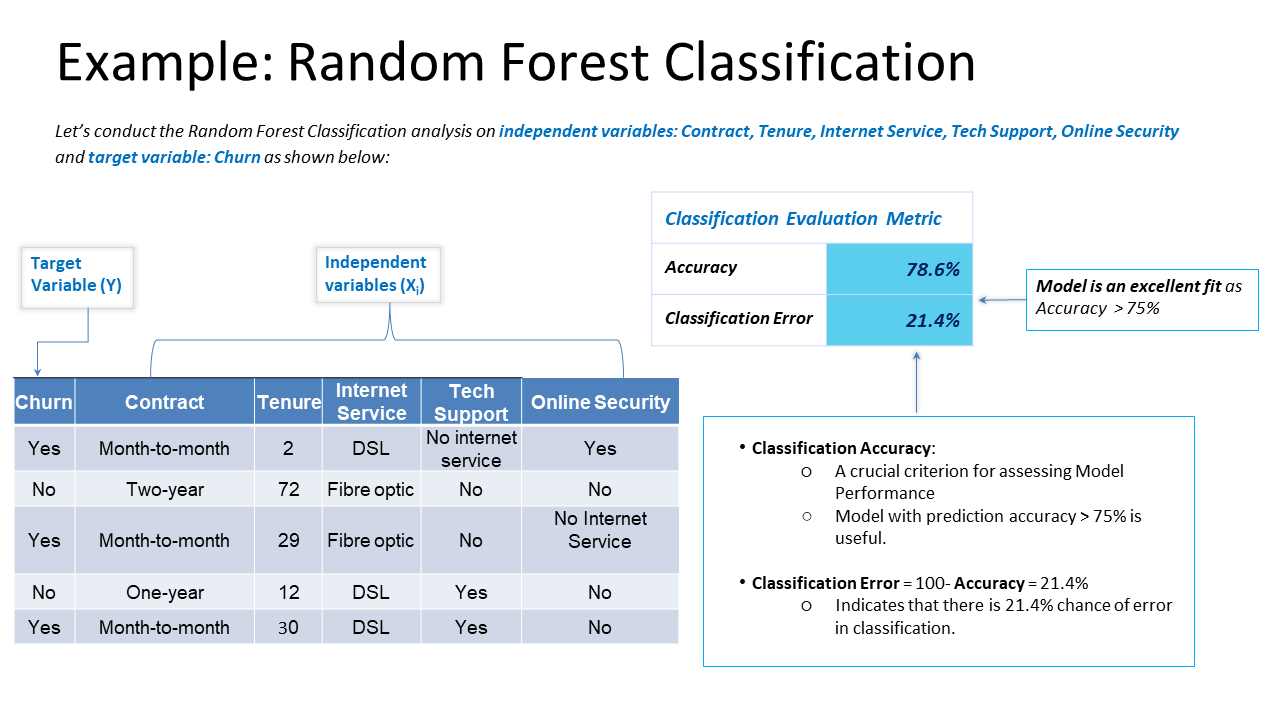
The Random Forest Classification model constructs many decision trees wherein each tree votes and outputs the most popular class as the prediction result.
Random Forest Classification output helps identify important factors impacting the dependent variable and the nature of relationship between each of these factors and dependent variable. Random Forest Classification is limited to predicting categorical output so the dependent variable has to be categorical in nature. The minimum sample size is 20 cases per independent variable.
To further clarify the use of the Random Forest Classification model, let’s look at a sample customer churn analysis to predict the likelihood of customers to churn based upon important factors.
How Can Random Forest Classification Be Helpful for Business Analysis?
Explore the use cases below, to better understand the value of Random Forest Classification.
Business Use Case 1
Business Problem: Predict loan default.
Based on the historical data related to credit card payments, loan payments, existing loan status, job status we want to classify/divide the customers into defaulters and non defaulters.
Target/dependent variable:
- Default Status
Predictor/independent variables:
- Home ownership status
- Existing loan status
- Occupation
- Account Balance
Business Benefit:
The predictive model will help us identify whether a customer fails to repay the loan depending on certain factors, which would lead to easier identification of risky customers and help the bank avert the risk delinquencies.
Business Use Case 2
Business Problem: Predict quality of Red Wine.
The data is a result of analysis to determine the quality of the red wine based upon chemicals it consists of.
Target/dependent variable:
- Quality category
Predictor/independent variables:
- Citric Acid
- Density
- Residual Sugar
- Chlorides
Business Benefit:
Using random forest classification, we can determine the quality of red wine (high, low) based upon its influential chemical attributes.
The Smarten approach to augmented analytics and modern business intelligence focuses on the business user and provides tools for Advanced Data Discovery so users can perform early prototyping and test hypotheses without the skills of a data scientist. Smarten Augmented Analytics tools include Assisted Predictive Modeling, Smart Data Visualization, Self-Serve Data Preparation, Clickless Analytics with natural language processing (NLP) for search analytics, Auto Insights, Key Influencer Analytics, and SnapShot monitoring and alerts. These tools are designed for business users with average skills and require no specialized knowledge of statistical analysis or support from IT or data scientists. Businesses can advance Citizen Data Scientist initiatives with in-person and online workshops and self-paced eLearning courses designed to introduce users and businesses to the concept, illustrate the benefits and provide introductory training on analytical concepts and the Citizen Data Scientist role.
The Smarten approach to data discovery is designed as an augmented analytics solution to serve business users. Smarten is a representative vendor in multiple Gartner reports including the Gartner Modern BI and Analytics Platform report and the Gartner Magic Quadrant for Business Intelligence and Analytics Platforms Report.
 Advanced Analytics, Augmented Analytics, Augmented Analytics Education, Augmented Analytics Learning, Data Literacy, Learning for Citizen Data Scientist, Random Forest Classification, Smarten