

This article provides a brief explanation of the definition and uses of the Descriptive Statistics algorithms.
What is a Descriptive Statistics?
Descriptive statistics helps users to describe and understand the features of a specific dataset, by providing short summaries and a graphic depiction of the measured data. There are numerous methods of descriptive statistics, including Mean, Median, and Mode methods of averaging data and percentile, quartile, skewness and standard deviation/variance measurements as well as plotting methods like box plots and histograms.
To better understand these methods, let’s take a moment to review each.
Mean is the average of all the data values. This measurement can be biased in a case where there are a significant number of outliers present in the data.
Median is the value in the middle when the data items are arranged in ascending order. This measure is relatively robust where there are a significant number of outliers present in data.
Mode is the most frequently occurring value in a series of data. If there is no repeating value in the data, there would be no mode.
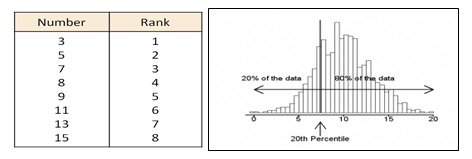
Percentile represents a percentage position in a list of data. For example, the 20th percentile is the value below which 20% of the observations may be found.
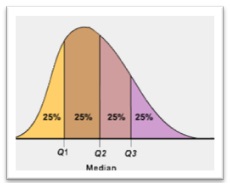
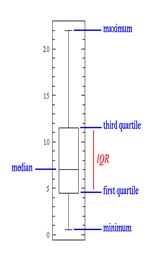
Quartile represents the specific percentiles which divide the dataset into four equal parts. For example, Q1 = 25th Percentile, Q2 = 50th Percentile = Median, Q3 = 75th Percentile.
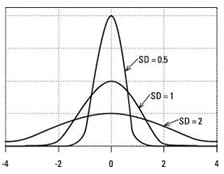
Standard Deviation/Variance are both popular measures of the spread of data points measured from a center value mean.
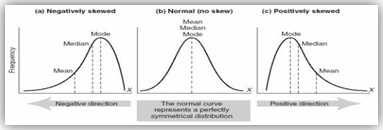
Skewness is a measure of symmetry. A dataset is symmetric if it looks the same to the left and right of the center point.
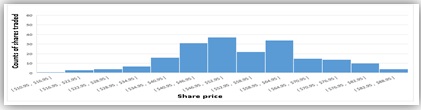
Histogram is a graphical display where the data is grouped into buckets and then plotted as bars.
Box Plot is a standardized way of displaying data distribution based on the five-number summary: minimum, first quartile, median, third quartile, and maximum.
How Does One Choose the Right Descriptive Statistics Algorithm for Enterprise Analysis?
Let’s look at a few use cases for the various types of descriptive statistics.
1) Mean/Median
Business Problem: Find out the average age and income for a particular type of product category purchased.
Business Benefit: By identifying mean/median income of this segment, one can target marketing to this segment in order to improve ROI and sales revenue. Be sure to choose the right method for the type of data. For example, median is a better measure than mean if the business wishes to get an accurate picture. The median method would more accurately address the outliers in terms of extreme income values, whereas the mean method would skew the overall average when extreme income values are taken into the dataset.
2) Mode
Business Problem: Identify the most popular dish served in the restaurant or find out the most frequent rating given by customers for a given movie/ restaurant or most frequent size or category of a sold product etc.
Business Benefit: By identifying the mode of a name of Dish purchased, a restaurant owner can determine the most popular dish and decide on pricing and anticipate the need to order ingredients.
3) Percentile
Business Problem: A bank’s loan manager needs to find out the percentile distribution of the credit score of the loan applicants.
Business Benefit: By checking the credit score distribution, the loan manager will know the percentage of applicants that fall in the top 10 percentile and can estimate the total number of eligible loan applicants based on the bank’s set criteria for loan eligibility in terms of credit score.
4) Quartile
Business Problem: A business owner wants to reduce the business process cycle time.
Business Benefit: By checking Q1, Q3 and Inter quartile range (Q3-Q1) values of each step of the process, the owner can determine which particular step has a scope of time reduction.
5) Standard Deviation/Variance
Business Problem: A stock broker wants to analyze the price volatility of a stock as a measure of risk.
Business Benefit: By analyzing the standard deviation or variance, one can measure the risk associated with a particular stock in terms of price fluctuations.
6) Skewness/Histogram
Business Problem: A quality control manager of a company producing elevator rails needs to know which machine is ideal to produce rails.
Business Benefit: If the required diameter for an elevator rail is 3 inches, the quality control manager can determine which machines would produce rails that are too narrow and which would be too wide and choose the right machine without producing samples that would result in lost time and waste materials.
Flexible self-serve business intelligence and analytical tools will ensure data democratization among business users, and provide a comprehensive toolset to be used for planning methods and to test theories and clearly illustrate results by type, time period or other variables. Descriptive Statistical algorithms are sophisticated techniques that, within the confines of a self-serve analytical tool, can be simplified in a uniform, interactive environment to produce results that clearly illustrate answers and optimize decisions.
The Smarten approach to augmented analytics and modern business intelligence focuses on the business user and provides tools for Advanced Data Discovery so users can perform early prototyping and test hypotheses without the skills of a data scientist. Smarten Augmented Analytics tools include assisted predictive modeling, smart data visualization, self-serve data preparation, Clickless Analytics with natural language processing (NLP) for search analytics, Auto Insights, Key Influencer Analytics, and SnapShot monitoring and alerts. These tools are designed for business users with average skills and require no specialized knowledge of statistical analysis or support from IT or data scientists. Businesses can advance Citizen Data Scientist initiatives with in-person and online workshops and self-paced eLearning courses designed to introduce users and businesses to the concept, illustrate the benefits and provide introductory training on analytical concepts and the Citizen Data Scientist role.
The Smarten approach to data discovery is designed as an augmented analytics solution to serve business users. Smarten is a representative vendor in multiple Gartner reports including the Gartner Modern BI and Analytics Platform report and the Gartner Magic Quadrant for Business Intelligence and Analytics Platforms Report.
 Bank Loan, Data Literacy, Descriptive Statistics, Mean, Median, Mode, Percentile, Product Popularity, Quality Control, Quartile, Training for Citizen Data Scientist
Other posts


