Cross-Tab and Tabular Reporting Tools Are Foundational!
The evolution of advanced analytics has been rapid and impressive. With features that provide support for business users and help to transition them into Citizen Data Scientists, and the addition of Artificial Intelligence (AI) and other capabilities like Natural Language Processing (NLP) and search analytics, augmented analytics is suitable for every team member in your organization. It is easy to be impressed with all of the new bells and whistles and these additions certainly do make a user’s life easier and help the organization to analyze and use data in a more meaningful way.
But while we are admiring these new BI tools and analytics features and technologies, we should give equal respect to the bread and butter of the business intelligence (BI) and analytical landscape! Foundational, comprehensive visualization techniques are not only meaningful, they are mandatory.
‘With flexible views and report formats and interactive features and presentation capabilities, your business users, managers, IT team and data scientists can leverage data across disparate data structures and view and present that data with intuitive formats for fact-based decision-making.’
Analytics and business intelligence (BI) tools provide many such options including:
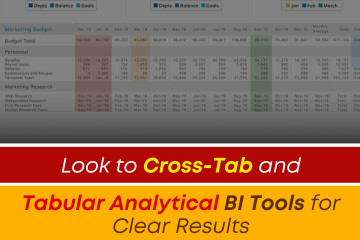
Cross-Tab – Cross-tabulation analysis (or crosstabs), analyzes and categorizes data to reveal the relationship between two or more variables to help you make sense of survey results, reveal actionable tasks, find patterns and correlations. Cross-tab analytics can be used for categorical variables (with independent or dependent variables), for contingency tables, marginal totals, or conditional frequencies, and many other purposes.
Tabular – Tabular visualization facilitates quick comparison of data in a tabular form, marrying data classification with data presentation to reveal measures and averages in a structured format that is easy to manipulate, compare and understand. Tabular analytics can be used for statistical analysis or units of measure among other uses.
According to research at the University of North Carolina (UNC), cross-tab and tabular analytics account for 90% of the analytical techniques used in all research analysis.
A BI reporting tool that enables users to customize their view and approach and is easy to understand and use will make the user more productive and ensure Return on Investment (ROI).
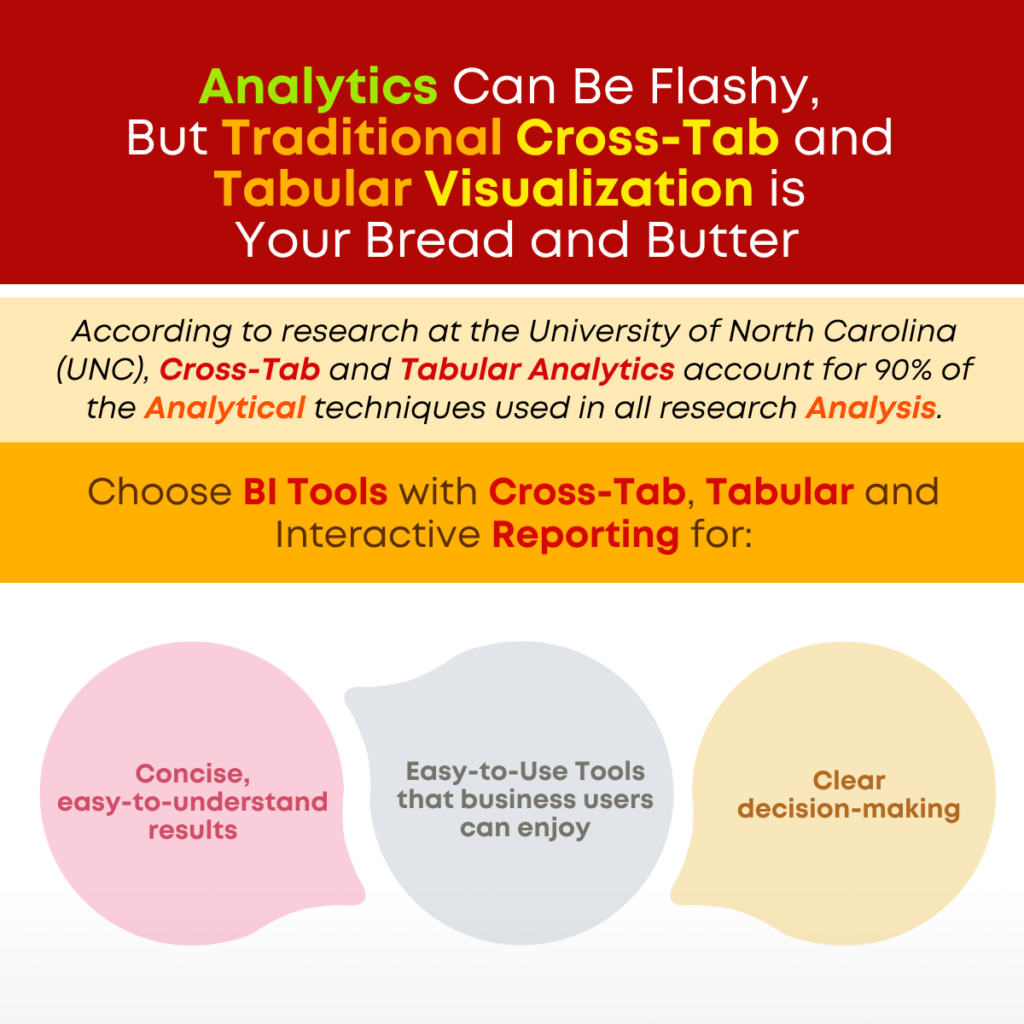
These foundational analytical visualization techniques are easy to understand and use and are suitable for business users and all team members. When you choose a Business Intelligence reporting tool that enables report, template and document design and configuration and supports preprinted fixed formats too. With flexible views and report formats and interactive features and presentation capabilities, your business users, managers, IT team and data scientists can leverage data across disparate data structures and view and present that data with intuitive formats for fact-based decision-making. IT team members or consultants can leverage a simple, basic programming or scripting environment to define format templates and use data from Datasets and objects to produce stunning pixel perfect reports. Users can preview reports, export data to PDF files and share documents and reports via email at predefined frequency using delivery and publishing agents.
‘While we are admiring new BI tools, features and technologies, we should give equal respect to the bread and butter of the business intelligence (BI) and analytical landscape! Foundational, comprehensive visualization techniques are not only meaningful, they are mandatory.’
To learn more about Traditional BI Tools And Visualization Techniques and the promise of augmented analytics and Advanced Reporting Tools, contact us now. Find out how to ensure Return on Investment (ROI) and Total Cost of Ownership (TCO) results, gain a competitive market advantage, and enable user adoption, read our free White Paper, ‘A Roadmap To ROI And User Adoption Of Augmented Analytics And BI.’ Explore The Benefits of our Augmented Analytics And BI Tools, Contact Us. Keep pace with changing enterprise needs and support business agility. Let us help you realize your business goals and objectives with fact-based information, and flexible, scalable technology solutions that will support Citizen Data Scientist initiatives, and improved data literacy and data democratization.
Original Post : Look to Cross-Tab and Tabular Analytical BI Tools for Clear Results!
 Analytics and BI Platform, Augmented Analytics Tool, BI Tools, BI Tools India, Business Intelligence, Business Intelligence Reports, Data Visualization Software, Report Software
Other posts