
This article discusses the Paired Sample T Test method of hypothesis testing and analysis.
What is the Paired Sample T Test?
The Paired Sample T Test is used to determine whether the mean of a dependent variable e.g., weight, anxiety level, salary, reaction time, etc., is the same in two related groups. For example, one might consider two groups of participants that are measured at two different “time points” or two groups that are subjected to two different “conditions”. Paired T Test is used to evaluate the before and after of a situation, treatment, condition, etc.
For example, a business might use this technique to understand whether there was a difference in manager salaries before and after undertaking a PhD program. In this case, the metrics would be, “salary”, and the two related groups would be the two different “time points”; that is, salaries “before” and “after” completion of the PhD program.
Here is another example. Let’s say that a medical organization wishes to measure the blood pressure of patient A, and then recommend a treatment plan like medication, diet or exercise to reduce his blood pressure, after which the organization would measure the blood pressure of patient A again. When this process is applied to patients B, C, and D, the results of the analysis for “Before” and “After” can be paired by patient to determine the effects and success rate of these treatments.
Paired Sample T testing can be applied only to two samples: one measure and one time dimension, or a sequence ID to decide the point where analysis will divide the measurement values into pre and post samples. The number of data points for Paired Sample T Tests should be at least 30.
Let’s conduct the Paired Sample T-Test on two variables. One is a time dimension containing months and the other is a measure.
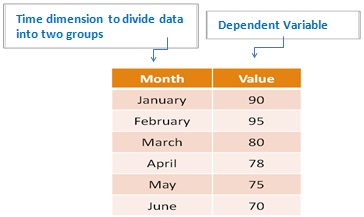
Let’s say that the measurement values before April belong to the ‘before’ or ‘pre’ sample and from April belong to the ‘After’ or ‘post’ sampling.
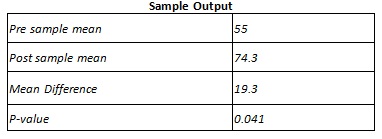
- At 95% confidence level (5% chance of error): As p-value = 0.041 which is less than 0.05, there is a statistically significant difference between means of pre and post sample values. Therefore, the treatment was effective.
- At 98 % confidence level (2% chance of error): As p-value = 0.041 which is greater than 0.02, there is no statistically significant difference between the means of pre and post samples. Therefore, the treatment was not effective.
How is the Paired Sample T Test Beneficial to Business Analysis?
This type of analysis can be useful in numerous situations.
- Medicine – Has the particular medicine or treatment been effective?
- Marketing – Have sales increased following a particular campaign?
- Manufacturing – Has the cycle time or defect instance been reduced following a particular process change.
- Logistics – Has the transit time reduced from supplier to customer following a route change.
Let’s look at two use cases to better understand the benefit of this technique in business analysis.
Use Case – 1
Business Problem: A manufacturing unit manager want to know if there is a statistically significant difference in cycle time pre and post a particular process change. Here the dependent variable would be ‘cycle time values’.
Business Benefit: Once the test is completed, p-value is generated which indicates whether there is statistical difference between cycle time of both time points. Based on this value, a manager can easily conclude whether a particular process change has had a significant impact on cycle time.
Use Case – 2
Business Problem: A grocery store sales manager wants to know whether daily sales have increased after an advertising campaign. Here the dependent variable would be ‘Daily sales’.
Business Benefit: Once the test is completed, p-value is generated which indicates whether there is a statistical difference between the average daily sales- pre and post an advertising campaign. Based on this value, grocery store manager can get to know if the campaign has been effective.
The Paired Sample T Test used to determine whether the mean of a dependent variable and is particularly useful in measuring results before and after a particular event, action, process change, etc. Paired Sample T testing can be applied only to two samples: one measure and one time dimension.
The Smarten approach to augmented analytics and modern business intelligence focuses on the business user and provides tools for Advanced Data Discovery so users can perform early prototyping and test hypotheses without the skills of a data scientist. Smarten Augmented Analytics tools include assisted predictive modeling, smart data visualization, self-serve data preparation, Clickless Analytics with natural language processing (NLP) for search analytics, Auto Insights, Key Influencer Analytics, and SnapShot monitoring and alerts. These tools are designed for business users with average skills and require no specialized knowledge of statistical analysis or support from IT or data scientists. Businesses can advance Citizen Data Scientist initiatives with in-person and online workshops and self-paced eLearning courses designed to introduce users and businesses to the concept, illustrate the benefits and provide introductory training on analytical concepts and the Citizen Data Scientist role.
The Smarten approach to data discovery is designed as an augmented analytics solution to serve business users. Smarten is a representative vendor in multiple Gartner reports including the Gartner Modern BI and Analytics Platform report and the Gartner Magic Quadrant for Business Intelligence and Analytics Platforms Report.
 Citizen Data Scientist, Data Literacy, Grocery Store Sales, Manufacturing Cycle Time, Paired Sample T Test