This article focuses on the Independent Samples T Test technique of Hypothesis testing.
What is the Independent Samples T Test Method of Hypothesis Testing?
The independent sample t-test is a statistical method of hypothesis testing that determines whether there is a statistically significant difference between the means of two independent samples.
For example, one might use this method of analysis to determine whether the average value of a sedan type of car is significantly different from an SUV type of car. Here the hypothesis would be set as null hypothesis: SUV and Sedan car types have insignificant difference in terms of value, and the alternative hypothesis Value of SUV and Sedan: differ significantly.
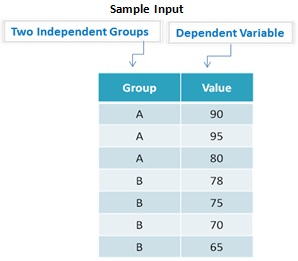
Let’s look at a sample of the Independent t-test on two variables. One is a dimension containing two values and the other is a measure.
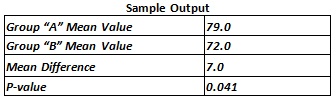
- At 95% confidence level (5% chance of error): As p-value = 0.041 which is less than 0.05, there is a statistically significant difference between the means of two groups A and B. Mean of Group A is significantly higher than that of Group B.
- At 98 % confidence level (2% chance of error): As p-value = 0.041 which is greater than 0.02, there is no statistically significant difference between the means of two groups A and B.
How Can the Independent Samples T Test Method Benefit an Organization?
The Independent Samples T Test Method of Hypothesis testing can be used to address various needs in various types of industries and organizations.
- Medicine – Has the quality of life improved for patients who took drug A as opposed to patients who took drug B?
- Sociology – Are men more satisfied with their jobs than women? Do they earn more?
- Biology – Are foxes in one specific habitat larger than in another?
- Economics – Is the economic growth of developing nations larger than the economic growth of the first world?
- Marketing – Does customer segment A spend more on groceries than customer segment B?
To better understand the benefits of the Independent Sample T Test Analysis, let’s look at two use cases:
Use Case – 1
Business Problem: An HR Manager wants to find out whether male employees earn more than female employees. Here, the dependent variable would be ‘Total Annual Income’.
Business Benefit: Once the test is completed, a p-value is generated which indicates whether there is a statistical difference between the income of two groups. Based on this value, a manager can easily conclude whether the average income earned by female employees is statistically different from male employees and if the different is statistically significant they can further conclude which gender earns higher or lower salaries.
Use Case – 2
Business Problem: A Grocery store sales manager wants to know whether customer segment A spends more on groceries than customer segment B. Here, the dependent variable would be ‘Purchase Amount’.
Business Benefit: Once the test is completed, a p-value is generated which indicates whether there is a statistical difference between the purchase amounts of both segments. Based on this value, the grocery store manager can decide on its marketing strategies for better sales and increased revenue.
The independent sample t-test is a useful statistical method of hypothesis testing when an organization wants to determine whether there is a statistical difference between two categories or groups or items and, furthermore, if there is a statistical difference, whether that difference is significant.
The Smarten approach to augmented analytics and modern business intelligence focuses on the business user and provides tools for Advanced Data Discovery so users can perform early prototyping and test hypotheses without the skills of a data scientist. Smarten Augmented Analytics tools include assisted predictive modeling, smart data visualization, self-serve data preparation, Clickless Analytics with natural language processing (NLP) for search analytics, Auto Insights, Key Influencer Analytics, and SnapShot monitoring and alerts. These tools are designed for business users with average skills and require no specialized knowledge of statistical analysis or support from IT or data scientists. Businesses can advance Citizen Data Scientist initiatives with in-person and online workshops and self-paced eLearning courses designed to introduce users and businesses to the concept, illustrate the benefits and provide introductory training on analytical concepts and the Citizen Data Scientist role.
The Smarten approach to data discovery is designed as an augmented analytics solution to serve business users. Smarten is a representative vendor in multiple Gartner reports including the Gartner Modern BI and Analytics Platform report and the Gartner Magic Quadrant for Business Intelligence and Analytics Platforms Report.
 Citizen Data Scientist, Data Literacy, Grocery Store Sales, Human Resources, Independent Samples T Test, Marketing
Other posts