1. The more the merrier, but the fewer the better!
Often, it’s difficult to determine the impact of an individual influencer on the response variable when multiple influencing factors have more or less the same influence. Let’s streamline this with a realistic example. Say for instance, we want to examine a child’s weight based upon various influencing factors including child’s height and age. It becomes evident that as children grow older, they get taller! Hence, both height as well as age are highly correlated in determining child’s weight. So, this case study has indeed a multicollinearity problem!
2. Remove Collinearity, Remove Redundancy
Multicollinearity exists in regression analysis when one or more independent variables are highly correlated with each other making it difficult to distinguish their individual impact on the outcome variable in turn undermining the statistical significance of the correlated variable upon response variable. In layman’s terms, independent variables must be “independent” of each other and not correlated with each other for regression analysis. The key motive of regression is to isolate the relationship between each independent variable and dependent variable.

In best case scenario, the regression coefficient interprets change in dependent variable (i.e., Y) with a unit change in independent variable (i.e., Xi), holding all the other independent variables as constant. However, when the independent variables are highly correlated, it indicates that the changes in one variable are associated with changes in other correlated variables, making it difficult to estimate independent relationships of variables with the target. So, a big challenge is to deal with collinearity maintaining independence of each attribute!
3. Smarten Assisted Predictive Modelling: Take the Guesswork out of Planning!
Every organization must plan and forecast results. If the enterprise is to succeed, it must strive for accuracy and identify trends and patterns in the market and industry that will help it to predict future results, plan for growth and capitalize on opportunities. Smarten Insight provides predictive modeling capability and auto-recommendations and auto-suggestions to simplify use and allow business users to leverage predictive algorithms without the expertise and skill of a data scientist.
4. Handling Multicollinearity in Regression Analysis using Smarten
Having knowledge upon the consequences of Multicollinearity, both in terms of statistical as well as predictive inferences made from regression analysis, it becomes crucial to get rid of it at a preliminary stage before processing our regression model. One of the straightforward yet effective ways to deal with this problem is to remove the highly correlated predictor variables and retain a single independent variable corresponding to all the correlated variables based upon its feature importance in predicting the outcome.
Let’s take a look at the process bit by bit…
4.1. Ultimately, how much sales happens is what matters!
Predictive sales analytics plays critical role in maximizing productivity of any business. Moreover, it brings great relief to companies working with sales. Often there are too many items of one product on stock creating risk not to have enough space for other goods or to be forced to sell at a discount. On the contrary, the sales fall when the items are too few. Prediction of future sales allows them to avoid these problems and make better decisions. Product’s selling price relies on number of factors such as the product category, brand name, sales quantity of the product, cost of goods while making the product, marked price, gross sales to name a few. Predicting product sales thus becomes a crucial exploration and it would be rather interesting to relate multicollinearity phenomenon with this use case using Smarten Assisted Predictive Modelling!
4.2. If we have data, let’s look at it!
Any kind of analysis initiates by looking upon the data. Keeping a note that we already have a predefined dataset uploaded to Smarten, let’s view the product sales dataset and understand the effect of multicollinearity in predicting the sales price of a product.
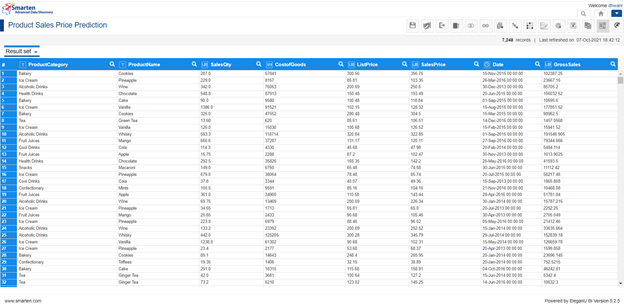
Product Sales Price Prediction Dataset
SalesPrice hereby represents a continuous variable indicating the selling price of the corresponding product. The remaining columns (i.e., ProductCategory, ProductName, SalesQty, CostofGoods, ListPrice, Date and GrossSales) represents the factors based upon which one can make their optimal predictions. One can explore this problem statement of predicting the sales price based upon influencing factors as a regression analysis with SalesPrice being the target variable.
4.3. Create a fresh New Smarten Insight
Go to New -> SmartenInsight Menu in the dropdown provided in the top right corner of the Smarten Dashboard.
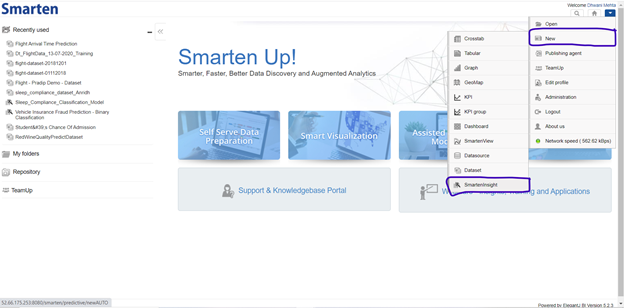
Creating a new Smarten Insight
4.4. Select the Data to perform exploratory analysis upon
Let’s choose Product Sales Price Prediction dataset for our analysis purpose followed by clicking the NEXT button to proceed for further actions.
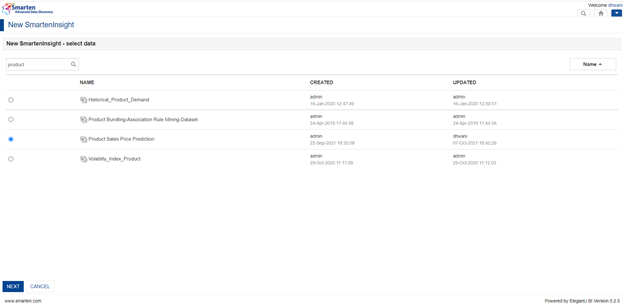
Selecting Product Sales Price Prediction dataset to perform analysis
4.5. Perform Sampling or Filtering if required
For our current objective to deal with the multicollinearity aspect in regression analysis, let’s consider the entire data passed and understand the results. Click the Next icon to jump to the preceding step.
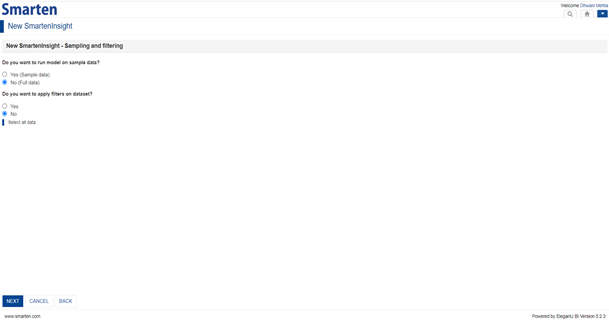
Amount of Dataset for Analysis to be considered option
4.6. Perform Data Pre-processing steps if requisite and click Next

Data pre-processing using Smarten
4.7. Now we are all set to perform Regression Analysis for our sales data
On selecting the regression algorithm for our SmartenInsight, Smarten is automated to suggest its users with apt target and corresponding influencing predictors, moreover providing flexibility to alter the suggested target or predictors in order to perform requisite exploratory analysis.
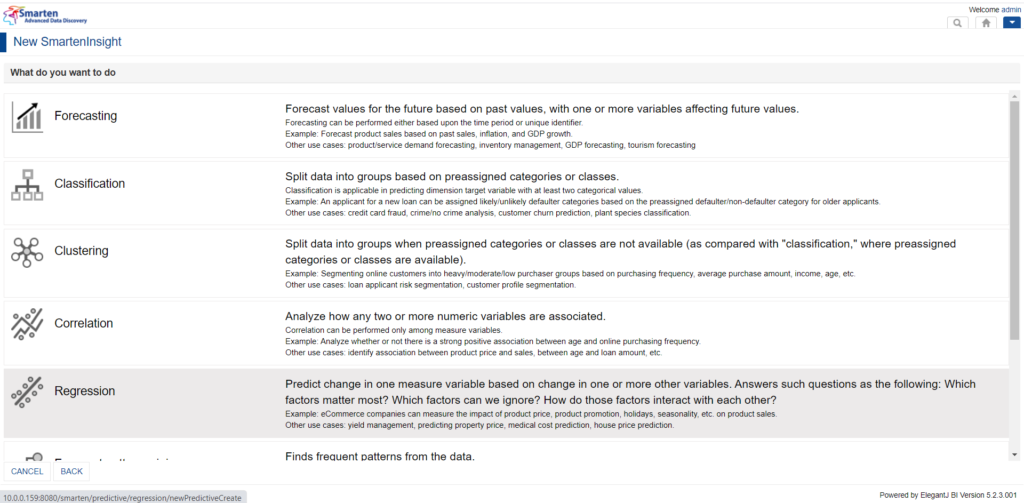
Selecting Regression as algorithm technique
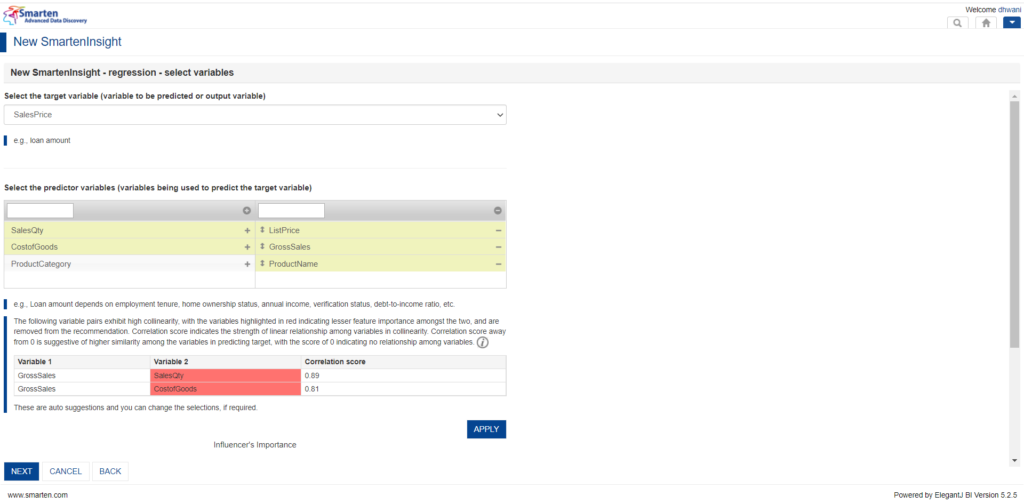
4.8. And here we go! We are ready with required target and predictors
From the below screen, it can be inferred that SalesPrice is our target variable and ListPrice, GrossSales and ProductName being the encouraged influencing predictors as well as recommended predictors exhibiting multicollinearity effect as auto suggested by Smarten.
Auto-Handling of Multicollinearity in Smarten Insight
4.9. Too many cooks spoil the broth
It becomes evident from the screen above that a product’s gross sales is highly correlated with the sales quantity as well as cost of goods with correlation scores as high as 0.89 and 0.81 respectively. A sage insight can be hereby drawn that gross sales (i.e., the grand total of the sale transaction for a product) is highly dependent upon the quantity of sales of that product over period of time. Hence, more the sales quantity for a product, clearly more will be the gross sales. Furthermore, the cost of goods for making the product also exhibit high multicollinearity with its gross sales. Let’s consider our product for sales be Chinese noodles. More the cost of goods (here say more variety of sauces, pepper, veggies, beans etc.) included in making the dish, more appetizing the noodles will be encouraging more gross sales of the product. In order to obtain better estimation for the regression model, we must remove the multicollinearity effect from it by dropping one of the highly correlated variables from the pairs obtained as either one almost has the same impact on our target variable (i.e., SalesPrice). For our current examination of predicting a product’s sales price, product sales quantity and cost of goods, as a consequence of the multicollinearity effect, have been removed from our regression analysis. Smarten automatically computes each predictor’s feature importance in predicting the outcome and drops the lesser important features (marked in red in the table shown above) with multicollinearity to obtain satisfactory regression analysis outcome.
Original Post : Handling Multicollinearity using Smarten Augmented Analytics!
 Augmented Analytics Support, Business Intelligence Support, Smarten Support, Smarten Training
Other posts