In this article, we discuss the analytical method known as frequent pattern mining, previously known as ‘association’.
What is Frequent Pattern Mining?
Frequent Pattern Mining (AKA Association Rule Mining) is an analytical process that finds frequent patterns, associations, or causal structures from data sets found in various kinds of databases such as relational databases, transactional databases, and other data repositories. Given a set of transactions, this process aims to find the rules that enable us to predict the occurrence of a specific item based on the occurrence of other items in the transaction.
Let’s look at an example of Frequent Pattern Mining. First, we will want to understand the terminology used in this type of analysis. While there are numerous metrics and factors used in this technique, for this example, we will only consider two factors namely, Support and Confidence.
Support: The support of a rule x -> y (where x and y are each items/events etc.) is defined as the proportion of transactions in the data set which contain the item set x as well as y. So, Support (x -> y)= no. of transactions which contain the item set x & y / total no. of transactions.
Confidence: The confidence of a rule x -> y is defined as: Support (x -> y) / support (x). So, it is the ratio of the number of transactions that include all items in the consequent (y in this case), as well as the antecedent (x in this case) to the number of transactions that include all items in the antecedent (x in this case).
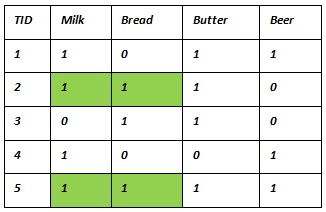
In the table below, Support (milk->bread) = 0.4 means milk and bread are purchased together occur in 40% of all transactions. Confidence (milk->bread) = 0.5 means that if there are 100 transactions containing milk then there will be 50 that will also contain bread.
How Does Frequent Pattern Mining Support Business Analysis?
This method of analysis can be useful in evaluating data for various business functions and industries.
- Basket Data Analysis – To analyze the association of purchased items in a single basket or single purchase.
- Cross Marketing and Selling – To work with other businesses that complement your own, not competitors. For example, vehicle dealerships and manufacturers have cross marketing campaigns with oil and gas companies for obvious reasons.
- Catalog Design – The selection of items in a business’ catalog are often designed to complement each other, so that buying one item will lead to buying another, so these items are often complements or closely related.
- Medical Treatments – Each patient is represented as a transaction containing the ordered set of diseases, and which diseases are likely to occur simultaneously/sequentially can be predicted.
To understand the value of this applied technique, let’s consider two business use cases.
Use Case – 1
Business Problem: A retail store manager wants to conduct Market Basket analysis to come up with a better strategy of product placement and product bundling.
Business Benefit: Based on the rules generated, the store manager can strategically place the products together or in sequence leading to growth in sales and, in turn, revenue of the store. Offers such as “Buy this and get this free” or “Buy this and get % off on this” can be designed based on the rules generated.
Use Case – 2
Business Problem: A bank-marketing manager wishes to analyze which products are frequently and sequentially bought together. Each customer is represented as a transaction, containing the ordered set of products, and which products are likely to be purchased simultaneously/sequentially can then be predicted.
Business Benefit: Based on the rules generated, banking products can be cross-sold to each existing or prospective customer to drive sales and bank revenue. For example, if savings, personal loan and credit cards are frequently/sequentially bought, then a new saving account customer can be cross-sold with a personal loan and credit card.
Frequent Pattern Mining (AKA Association Rule Mining) is an analytical process that finds frequent patterns, associations, or causal structures from data sets found in various kinds of data repositories. This method of analysis can be useful in evaluating data for various business functions and industries and is useful in determining the frequent patterns in buying behavior for various products and services, and in analyzing the relationships among various data points to cross-sell and bundle products, and service offerings, and to understand target audiences.
The Smarten approach to augmented analytics and modern business intelligence focuses on the business user and provides tools for Advanced Data Discovery so users can perform early prototyping and test hypotheses without the skills of a data scientist. Smarten Augmented Analytics tools include assisted predictive modeling, smart data visualization, self-serve data preparation, Clickless Analytics with natural language processing (NLP) for search analytics, Auto Insights, Key Influencer Analytics, and SnapShot monitoring and alerts. These tools are designed for business users with average skills and require no specialized knowledge of statistical analysis or support from IT or data scientists. Businesses can advance Citizen Data Scientist initiatives with in-person and online workshops and self-paced eLearning courses designed to introduce users and businesses to the concept, illustrate the benefits and provide introductory training on analytical concepts and the Citizen Data Scientist role.
The Smarten approach to data discovery is designed as an augmented analytics solution to serve business users. Smarten is a representative vendor in multiple Gartner reports including the Gartner Modern BI and Analytics Platform report and the Gartner Magic Quadrant for Business Intelligence and Analytics Platforms Report.
 Citizen Data Scientist, Data Literacy, Frequent Pattern Mining Association, Marketing and Selling, Medical Treatments
Other posts