In this article, we will focus on the identification and exploration of data patterns and the trends that data reveals. The business can use this information for forecasting and planning, and to test theories and strategies. Let’s look at the various methods of trend and pattern analysis in more detail so we can better understand the various techniques.
Linear Trend
A linear pattern is a continuous decrease or increase in numbers over time. On a graph, this data appears as a straight line angled diagonally up or down (the angle may be steep or shallow). So the trend either can be upward or downward.

Exponential Trend
This technique produces non linear curved lines where the data rises or falls, not at a steady rate, but at a higher rate. Instead of a straight line pointing diagonally up, the graph will show a curved line where the last point in later years is higher than the first year, if the trend is upward.

Damped Trend
In this analysis, the line is curved line to show data values rising or falling initially, and then showing a point where the trend (increase or decrease) stops rising or falling.

Seasonality
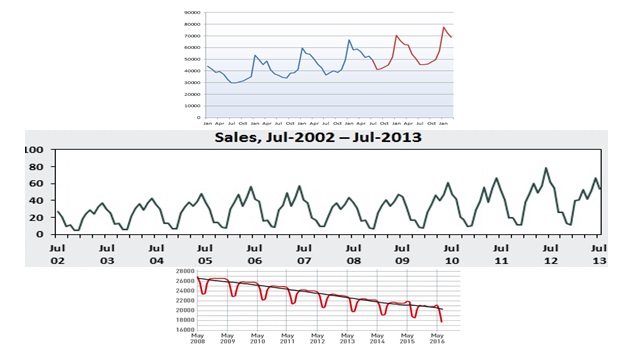
One can identify a seasonality pattern when fluctuations repeat over fixed periods of time and are therefore predictable and where those patterns do not extend beyond a one year period. Seasonality may be caused by factors like weather, vacation, and holidays. It usually consists of periodic, repetitive, and generally regular and predictable patterns. Seasonality can repeat on a weekly, monthly or quarterly basis.
Irregular/Random Patterns
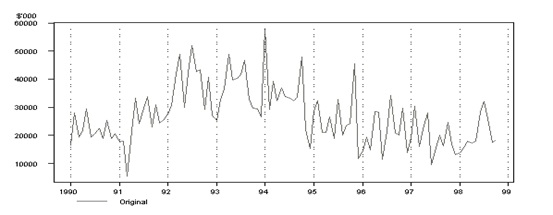
This type of analysis reveals fluctuations in a time series. These fluctuations are short in duration, erratic in nature and follow no regularity in the occurrence pattern. In prediction, the objective is to “model” all the components to some trend patterns to the point that the only component that remains unexplained is the random component.
Stationary/Stationarity
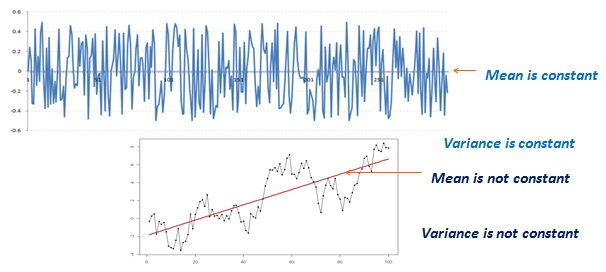
A stationary time series is one with statistical properties such as mean, where variances are all constant over time. A stationary series varies around a constant mean level, neither decreasing nor increasing systematically over time, with constant variance.
Cyclical Patterns
Cyclical patterns occur when fluctuations do not repeat over fixed periods of time and are therefore unpredictable and extend beyond a year.
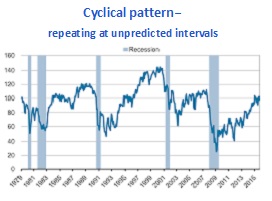
In this article, we have reviewed and explained the types of trend and pattern analysis. Every dataset is unique, and the identification of trends and patterns in the underlying the data is important. If a business wishes to produce clear, accurate results, it must choose the algorithm and technique that is the most appropriate for a particular type of data and analysis. For example, the decision to the ARIMA or Holt-Winter time series forecasting method for a particular dataset will depend on the trends and patterns within that dataset.
A basic understanding of the types and uses of trend and pattern analysis is crucial, if an enterprise wishes to take full advantage of these analytical techniques and produce reports and findings that will help the business to achieve its goals and to compete in its market of choice.
The Smarten approach to augmented analytics and modern business intelligence focuses on the business user and provides tools for Advanced Data Discovery so users can perform early prototyping and test hypotheses without the skills of a data scientist. Smarten Augmented Analytics tools include assisted predictive modeling, smart data visualization, self-serve data preparation, Clickless Analytics with natural language processing (NLP) for search analytics, Auto Insights, Key Influencer Analytics, and SnapShot monitoring and alerts. These tools are designed for business users with average skills and require no specialized knowledge of statistical analysis or support from IT or data scientists. Businesses can advance Citizen Data Scientist initiatives with in-person and online workshops and self-paced eLearning courses designed to introduce users and businesses to the concept, illustrate the benefits and provide introductory training on analytical concepts and the Citizen Data Scientist role.
The Smarten approach to data discovery is designed as an augmented analytics solution to serve business users. Smarten is a representative vendor in multiple Gartner reports including the Gartner Modern BI and Analytics Platform report and the Gartner Magic Quadrant for Business Intelligence and Analytics Platforms Report.


