This article provides a brief explanation of the ARIMA method of analytical forecasting.
What is ARIMA Forecasting?
Autoregressive Integrated Moving Average (ARIMA) predicts future values of a time series using a linear combination of its past values and a series of errors. This analytical forecasting method is suitable for instances when data is stationary/non stationary and is univariate, with any type of data pattern, i.e., level/trend/seasonality/cyclicity.
For more information about data trend and pattern analysis techniques, read our article entitled, ‘ What Are Data Trends and Patterns, and How Do They Impact Business Decisions?’
The ARIMA model is suggested for short term forecasting. ARIMA is only for univariate data forecasts, but there might be other variables affecting the output/dependent variable. ARIMA doesn’t take into account the influence of other predictors while forecasting, hence forecasts made might not be accurate.
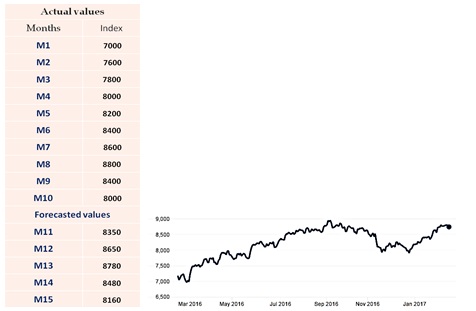
Let’s look at an example of a monthly analysis of monthly index values. The plot of this data suggests that this is non-stationary data and that it shows a gradual upward trend (see the figure below). The ARIMA algorithm would be a suitable method for forecasting analysis because the data exhibits non-stationarity, and trend.
The ARIMA forecasting technique uses three primary parameters for analysis within the model.
p: to apply autoregressive model on series
d: to apply differencing on series. It converts non-stationary data to stationary to allow for a fairly constant level over time
q: to apply moving average model on series
How Can the ARIMA Forecasting Method Be Used for Enterprise Analysis?
In order to further examine the ARIMA forecasting method, and its application within an organization, let’s look at a sample use case.
Business Problem: A pharmaceutical company wants to predict the sales of a drug for the next two months, based on drug sales data from the past 12 months.
Data Pattern: Input data exhibits non-stationarity and cyclical pattern.
Business Benefit: The business can make use of these forecasts for better planning of drug production and accuracy of sales targets. This analysis also helps to balance supply and demand for the drug.
The ARIMA forecasting method is suitable for forecasting when data is stationary or non-stationary and is univariate with any type of data pattern. It will produce accurate, dependable forecasts, when planning for short-term business results. ARIMA provides forecasted values of the target variables for user-specified periods to clearly illustrate results for planning, production, sales and other factors.
The Smarten approach to augmented analytics and modern business intelligence focuses on the business user and provides tools for Advanced Data Discovery so users can perform early prototyping and test hypotheses without the skills of a data scientist. Smarten Augmented Analytics tools include assisted predictive modeling, smart data visualization, self-serve data preparation, Clickless Analytics with natural language processing (NLP) for search analytics, Auto Insights, Key Influencer Analytics, and SnapShot monitoring and alerts. These tools are designed for business users with average skills and require no specialized knowledge of statistical analysis or support from IT or data scientists. Businesses can advance Citizen Data Scientist initiatives with in-person and online workshops and self-paced eLearning courses designed to introduce users and businesses to the concept, illustrate the benefits and provide introductory training on analytical concepts and the Citizen Data Scientist role.
The Smarten approach to data discovery is designed as an augmented analytics solution to serve business users. Smarten is a representative vendor in multiple Gartner reports including the Gartner Modern BI and Analytics Platform report and the Gartner Magic Quadrant for Business Intelligence and Analytics Platforms Report.
 ARIMA Forecasting, Data Literacy, Pharmaceutical Sales Forecast, Training for Citizen Data Scientist
Other posts